All call centers strive to keep their customers happy and operations profitable.
And they do this by tracking relevant call center data like metrics and KPIs (key performance indicator).
Call center dashboards are visual reporting tools that use powerful analytics features to help you monitor these key metrics. They help you gain actionable insights to make the right decisions.
In this article, we’ll cover everything you need to know about call center dashboards, including their key benefits and types. We’ll also share five practical tips on creating the best call center dashboard and three software suggestions.
This article covers:
(Click on the links below to go to a specific section)
- What are Call Center Dashboards?
- 4 Key Benefits of Dashboard Reporting
- 3 Types of Call Center Dashboards
- 5 Actionable Tips to Create Ultimate Call Center Dashboards
- 3 Best Call Center Dashboard Software in 2021
Let’s get started.
What are call center dashboards?
A call center dashboard is a visual tool that shows various call center metrics and KPIs in different formats. It can also generate accurate reports, performing actionable analytics on call center data.
Supervisors and agents can use dashboards to monitor day-to-day operations.
Additionally, senior managers can use them to see high-level visual reports summarizing the overall call center performance.
Here are some of the features of reliable call center dashboards:
- Simple graphical reports.
- Customizable views.
- Real-time insights and feedback.
- Powerful widget features.
4 key benefits of dashboard reporting
Dashboards can improve call center performance in many ways. Let’s check out a few of them:
1. Improves decision-making
Call center leaders need a bird’s eye view of the entire business to make critical decisions. However, inaccurate data can lead to poor decisions being made.
That’s why dashboards that clearly show key business performance metrics are helpful to call centers.
In addition to helping managers make informed decisions, they can also help you save time by not having to manually gather data or create presentations for CFOs and CXOs. Instead, you can simply present your dashboard to them.
2. Boosts agent productivity
It’s crucial for call center agents to remain productive during work hours.
However, it can get challenging for agents to monitor their workflow while handling customer calls during peak hours, let alone optimize it. As a result, they may lose focus and motivation over time.
Dashboards offer a perfect solution for agents to keep a tab on the benchmarks and their performance.
It gives them real-time feedback, which can help them self-correct any productivity issues. On top of that, agents will find the motivation to give their best, as they can see their own progress.
Moreover, dashboards can also generate agent productivity reports that help managers identify workflow issues and take the necessary actions to solve them.
3. Improves customer experience
Call center dashboards can help you track any customer experience KPI in real-time and generate insightful customer-centric reports.
These reports result from analyzing customer data over a period of time and can help build long-term customer retention strategies.
A call center can benefit from a dedicated customer-success dashboard that highlights the impact of customer success efforts on revenue. For example, it may help evaluate the relation between new investments and upsells or between downgrades and customer churn.
4. Helps meet SLA benchmarks
An SLA (Service Level Agreement) is a set of baseline service standards that the call center and its clients mutually agree upon.
For example, an SLA may require the call center to answer at least 90% of the calls within the first four rings or keep the total abandoned calls below 5%.
You can track SLA benchmarks through KPIs such as:
- Average response time.
- Server downtime.
- Service level.
- On-hold time, etc.
Dashboards help call center or contact center managers, team leaders, and agents monitor the relevant KPIs and ensure they deliver on these SLA benchmarks.
Most call center software offers a dedicated SLA management dashboard to monitor compliance in real-time.
Want to learn more about SLA?
Check out our detailed call center service level guide that includes a sample SLA.
3 types of call center dashboards

Call center dashboards can be divided into three broad categories that each cater to a specific function.
Let’s explore these call center dashboard examples in detail:
1. Customer experience dashboards
Customer experience (CX) is at the heart of call center operations.
Both outbound call (initiated by agents) and inbound call (initiated by customers) centers may benefit by building a dashboard that tracks vital customer metrics like:
- Customer satisfaction (CSAT): Measures a customer’s satisfaction with your products or services.
- Net promoter score (NPS): Quantifies the customers’ eagerness to recommend your products or services to others.
- Self-service usage: Measures how often your customers use self-service options.
These dashboards can mine crucial customer details from data sources like CRM (customer relationship management) tools, live calls, and web analytics tools.
Next, they present this data to the relevant stakeholders in the form of:
- Customer ratings and feedback for outbound or inbound calls in real-time.
- Interactive visual reports on customer journeys and behavior consolidated over a specific period of time.
A customer service dashboard consolidates all customer data into a single repository. This gives agents access to previous customer interactions and enables them to deliver consistent and personalized service experiences.
2. Agent performance dashboard
An agent dashboard is specifically designed to improve a team’s overall performance.
Investing in an agent dashboard can help:
- Agents set actionable goals using benchmarks and monitor their progress on a call-by-call basis.
- Supervisors monitor and improve their team’s performance.
These operational dashboards provide a granular view on agent performance by tracking KPIs such as:
- Average handle time (AHT): A metric that measures the average duration of customer calls.
- First call resolution (FCR): Tracks the percentage of calls where an agent resolves the customer issue during the first interaction.
- Declined or missed calls: A key metric that calculates the number of incoming calls that an agent actively declines or misses.
An agent dashboard can help call center managers optimize their training programs by highlighting common weak spots in agent performance.
Specialized dashboards such as agent status or agent activity provide real-time overviews of the entire support team and help managers with workforce management.
You can further boost team productivity by using gamification.
For example, the agents can compete in various tasks, and top-performing agents may feature on the dashboard at the end of each month or year.
3. Executive dashboard
The executive dashboard shows high-level call center statistics vital for making data-driven decisions on policy changes, process optimizations, new investments, and more.
A customer service manager or leader may choose from a simple Excel dashboard to a complex business intelligence dashboard to track key metrics.
Some standard metrics that call center executive dashboards track include:
- Average cost-per-call: A business metric that calculates the average cost incurred for each outgoing or incoming call.
- Total calls: Tracks the total number of calls (both inbound and outbound calls) that the call center registers in a specific amount of time.
- Abandon rate: Tracks the percentage of abandoned calls where customers hang up before reaching an agent.
These strategic dashboards can help call center leaders improve overall profitability while minimizing potential risk factors like high agent turnover or customer churn rate.
5 actionable tips to create ultimate call center dashboards
Here are five excellent tips that will help you build reliable call center metrics dashboards and improve performance across the board:
1. Keep it simple
Dashboards are visual tools that give you quick access to complex data. This complex data is usually presented in simple graphs and reports.
Overstuffing the dashboard with unnecessary information might lead to a laggy user interface (UI), defeating its purpose.
Here are a few pointers that’ll help you create clutter-free and highly operational KPI dashboards:
- Set clear goals when building dashboards.
- Build separate KPI dashboards for users with different permissions.
- Include information that’s relevant to the user.
- Use a hierarchical layout to emphasize the most critical metrics.
- Group related metrics together for easy access.
- Enable multiple views and perspectives using filters.
- Use data visualization tools like bars and charts to convey complex information.
- Use consistent design and color scheme throughout the dashboard interface.
- Round off KPI numbers for better readability.
A well-designed and responsive dashboard interface will help you get the most out of its features.
2. Choose the rights KPIs
With modern technology, it’s easy to track even the most complex call center KPIs.
However, call center leaders must pick KPIs that are relevant to their overarching objective.
Tracking too many metrics will drain your resources without creating any positive impact.
In addition, it can also lead to confusion and demotivation. But on the other hand, you may miss out on something important if you exclude critical KPIs.
Most inbound and outbound call centers would benefit by choosing a mix of the following four types of KPIs:
- Qualitative or perception metrics like customer satisfaction (CSAT) and net promoter score (NPS).
- Quantitative or descriptive metrics, such as handling time and service level.
- Outcome or lagging metrics like customer retention and agent turnover rate.
- Input or leading KPIs like first call resolution (FCR) and the average speed of answer (ASA).
Here are a few tips to shortlist the right set of metrics for your call center dashboard:
- Create clear customer service strategies and set specific goals.
- Choose KPI metrics that align with your business goals.
- Focus on incremental improvement rather than radical changes when shortlisting KPIs.
- Avoid adding metrics that rarely change over time.
- Create a separate section for metrics that don’t require real-time tracking.
3. Show historical data
Historical data helps call center employees monitor their progress towards a clear goal.
Adding historical data to your agent dashboard can act as a benchmark for their current performance.
The dashboard can compare real-time metrics with benchmark metrics to give instant feedback to the agents. It can also generate a thorough comparative analysis over time.
In addition, sharing historical data promotes accountability and self-correcting behavior among agents. Moreover, it can motivate agents since they can see how they’re improving daily.
4. Upgrade your dashboards
Call center operations and customer preferences are constantly evolving. As a result, your dashboards must reflect these changes too.
To do this, you should upgrade your dashboard technology consistently. It’s also a good idea to check for bugs and incorporate additional functionalities.
5. Learn and apply
By now, it’s clear that dashboards are a treasure chest of valuable insights into call center operations, contact center services, and customer expectations.
But these insights would mean nothing unless you learn from the process and bring about meaningful improvements.
Here’s how you can maximize benefits from dashboard reporting:
- Educate your agents about dashboard features and the importance of having a data-driven culture
- Review dashboard performance reports with your agents regularly and give them constructive feedback.
- Use reports to identify operational bottlenecks and make strategies to optimize processes.
- Use dashboards to keep the entire team on the same page about policies, expectations, and goals.
3 best call center dashboard software in 2021
Today, most customer support software offers customizable dashboards with powerful call center analytics and reporting features.
Here are our top three picks for the best dashboard software:
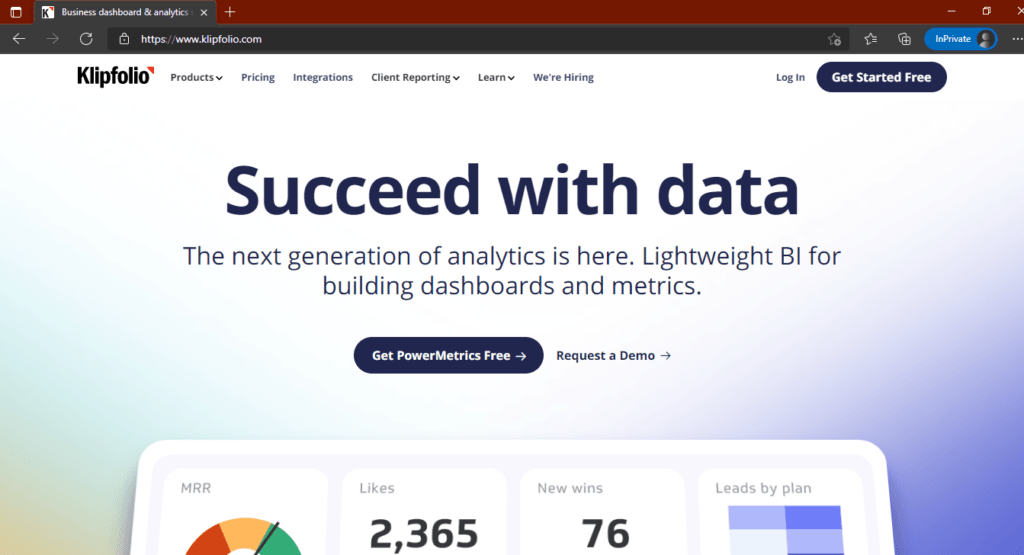
1. Klipfolio

Klipfolio is a software development company that offers data analytics and business dashboard solutions suitable for call center and contact center reporting.
a. Key features
- Supports a real time dashboard.
- Access to pre-built templates through the dashboard gallery.
- Create an Excel dashboard using spreadsheet data.
- Create insightful reports using data visualization.
b. Pricing
Paid plans start at $49/month per user (up to 5 users).
c. Customer ratings
- G2: 4.6/5 (190+ reviews)
- Capterra: 4.7/5 (160+ reviews)
2. Genesys

Genesys is a call center and contact center software that helps businesses deliver excellent customer support experiences. It also offers Genesys Pulse, which is a web-based analytics and reporting tool with powerful dashboard widgets.
a. Key features
- Use wallboards to broadcast real time data on a large screen for better visibility.
- Capture and store all customer interaction data from social media, chat, email, and more.
- A feature-rich report widget to build, customize, and display reports.
- Integrates with other popular customer service applications like Avaya.
b. Pricing
Paid plans start at $75/month.
c. Customer ratings
- G2: 4.3/5 (450+ reviews)
- Capterra: 4.1/5 (100+ reviews)
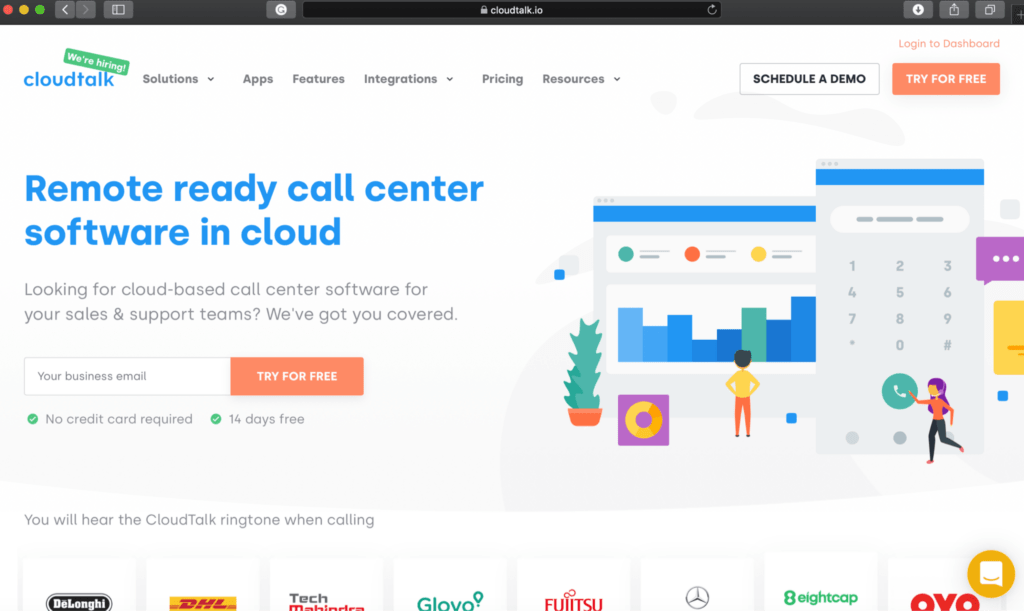
3. CloudTalk

CloudTalk is a cloud-based customer service software with powerful dashboard reporting features.
a. Key features
- Real time dashboard and wallboard to track key metrics.
- Detailed statistics that can be filtered by agent, client’s number, and timeframe.
- Built-in sentiment and emotion analytics to get instant feedback from customers.
- Powerful integration with popular applications like Pipedrive, Zendesk, and Hubspot.
b. Pricing
Pricing plans start at $20/month per user.
c. Customer ratings
- G2: 4.3/5 (200+ reviews)
- Capterra: 4.5/5 (200+ reviews)
Wrapping up
Modern call centers process tons of data each day. To ensure long-term success, they must put this data to good use.
Dashboards can help call centers leverage the power of data to improve overall call center or contact center performance and profitability. It combines reporting and analytics features to give you a clear picture of your workforce and business.
Use the tips and tools shared in this article to help you build reliable dashboards for your call center.

Andy is a technology & marketing leader who has delivered award-winning and world-first experiences.


